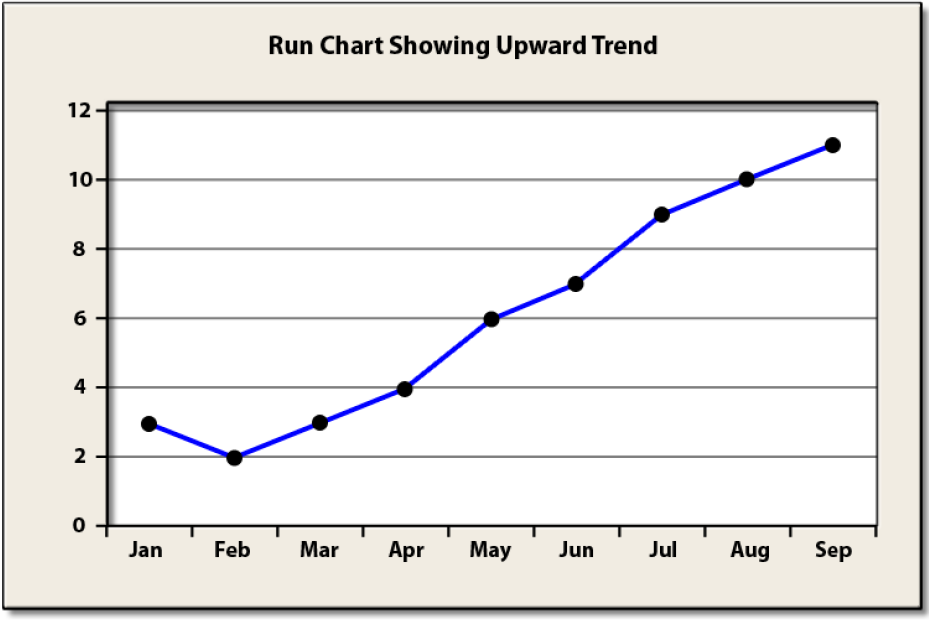
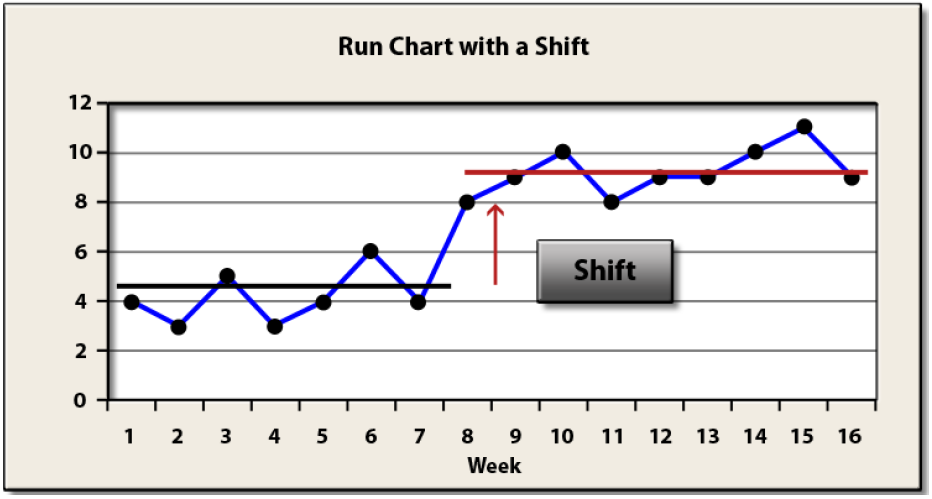
Posts tagged Run Chart


MethodologySix Sigma

Run Chart: Shifts

A Run Chart is a basic graph that displays data values in a time sequence (the order in which the data were generated). A run chart can be useful for identifying shifts and trends. A supervisor of a customer service center collects data on the number of complaints that are filed each month. Data for the last several weeks are shown below.

Read more 0 Comments
MethodologySix Sigma

Run Chart: Trends

A Run Chart is a basic graph that displays data values in a time sequence (the order in which the data were generated). A Run Chart can be useful for identifying shifts and trends. Example: A supervisor of a customer service center collects data on the number of complaints that are filed each month. Data for the last several months are shown below.

Read more 0 Comments