
The Analyze phase of DMAIC helps project teams identify problems in the production process that cause product defects. This phase of Six Sigma methodology is loaded with tools to help spot the problems in the production process and to determine if these problems are the root causes of defects.
Identifying Possible Causes
The Analyze stage focuses on the data gathered in the Measure phase of DMAIC to identify the cause of product defects. In typical Six Sigma fashion, identifying possible causes of defects is not left to hunches or guesswork. Six Sigma provides a host of tools to help identify the possible cause:
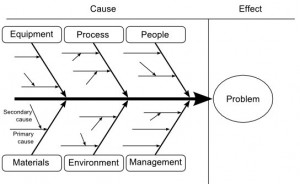 Cause and Effect Diagram – Sometimes known as the Fishbone Diagram, for its distinctive shape, this graphical tool helps the team identify the cause of the problem, not just the symptoms. This diagram enables a team to focus on the content of the problem rather than its history or the individual interests of team members. The problem is stated at the right side of the diagram. The project team works to the left by filling in and examining potential causes of problems such as materials, people and methods.

- Process Map Analysis – This tool uses a workflow diagram to capture the steps of a production process. The entire process is illustrated including inputs into the process, tasks performed, decisions required and outputs. The rigor demanded to record the production process on the page forces the project team to think through how the production process currently operates. A complete process map also gives the project team the chance to visualize potential changes in the process.
- Subprocess Mapping – In the Define phase of DMAIC the project team creates a general map of the process. These large processes are often composed of smaller processes. Subprocess mapping requires the team to diagram these smaller subprocess to attain a granular understanding of how the larger and smaller processes work and relate to each other. This map gives a detailed overview of the production process and allows the team to identify possible problems.
Finding the Root Cause
After the project team has identified a possible cause they must test to determine if it is the true cause of the problem. Six Sigma methodology uses several tools to help test the theory that a hitch in the production process is the root cause of a product defect.
- Regression Analysis – This tool helps estimate the impact variables in a process have on each other and on the final product. It allows the project team to measure how well the theory fits the data.
- ANOVA – This statistical technique tests three or more groups of data. It starts with a null hypothesis stating there is no significant difference between the groups. It then tests variation between the groups of data and variation within the groups of data. A high variation between groups of data indicates a possible root cause.
- Chi Square – The Chi Square tests whether the difference between the expected and observed results is significant. This tool can determine whether differences in the expected and observed results are due to chance or there is an independent cause.
The dual nature of Six Sigma allows the project team to begin analyzing the process by forming theories using subjective and observational process tools like Fishbone diagrams and process maps. It then imposes the strict mathematical rigor of Regression Analysis and Chi Square techniques to test the theory that these possible causes are responsible for the product defects.