
How to Use Lean Six Sigma for Better Time Management
Being on time is one of the biggest issues people struggle with every day in both their professional and personal lives. After decades of talking about the subject, and book …

Being on time is one of the biggest issues people struggle with every day in both their professional and personal lives. After decades of talking about the subject, and book …

San Luis Obispo County in California county recently announced a new program based on Lean Six Sigma. The program, called the Continuous Improvement Project, will focus on using data-driven tools …

Inflationary pressures continue to wreak havoc for many businesses, squeezing them between the twin realities of higher material costs and consumer demand for a stop to the price increases of …
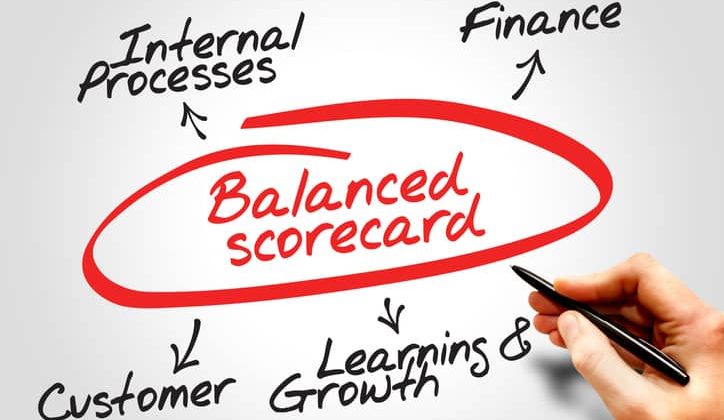
A balanced scorecard allows organizations to get feedback on the state of internal business processes and external outcomes, allowing leaders to sharpen performance and achieve better business results. This strategic …
One of the most important tenets of both Lean and Six Sigma is a consistent approach to business. There’s a good reason for that. Consistently cutting waste, reducing defects and …

Written by Contributing Columnist: David Larsen, PSP, PMP, LSSMBB It had been a long time since I’d last visited an amusement park. But my children were older and tall enough …

As part of its Liftoff for Learning drive, Boeing employees donated time and money to help ensure that school children in cities across the country had enough school supplies to …

Zero Quality Control refers to an ideal system that produces no defective products and therefore does not require frequent inspections that waste both money and time. Organizations that aspire to …
Zero Quality Control refers to the ideal process – one that produces zero defects and does not require frequent inspections. Achieving Zero Quality Control requires use of two Lean Six …
A Value Stream Map is a Lean tool used to examine a process for the presence of unnecessary and wasteful activities. It provides visibility of material flow and information flow in a process. On one diagram, the team can visualize the eight forms of waste (i.e., defects, over-production, waiting, non-utilized talent, transportation, inventory, motion, and extra processing.)