A Matrix Diagram is a tool that illustrates the critical relationships between or among two or more groups. It can be enhanced to show things like the strength of the relationship or the different aspects of the relationship. The basic L-Shaped Matrix Diagram shows the critical relationships of two groups of items (or it can be used to show the relationship of one group to itself).
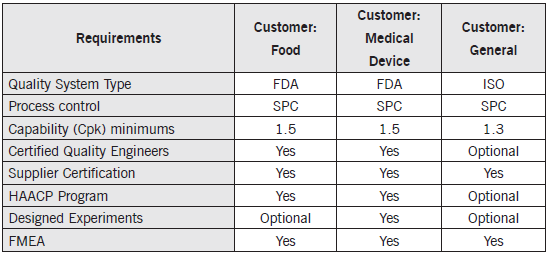
Example: One of the most common uses of the L-shaped matrix diagram is to illustrate the relationship of a set of customer requirements (group 1 items) to a selection of different customers (group 2 items). Suppose a producer of packaging materials has three distinct customers: packaging for food producers, packaging for medical device customers, and packaging for general use producers. The quality engineer might generate the following L-shaped matrix diagram to summarize the critical customer requirements for these distinct customers.
The L-shaped matrix diagram quickly illustrates the different requirements for the firm’s customers.

