
A histogram is used to show the distribution of a set of collected data.
Generic bar charts can be created for any type of categorical or numerical data. If the categories of the data plotted in a bar chart have no meaningful order, many different charts can be created by rearranging the order of the bars. Histograms, on the other hand, are used to show the pattern or the distribution of the data across the categories, so there must be only one correct pattern. For this to be true, the data charted must be from ordered categories (or classes). The axis that lists the data categories (typically the horizontal axis) must then be shown in the logical order of the data in order for a histogram to be meaningful. For this reason, histograms are typically only used with numerical data, although ordinal categorical data can also be used.
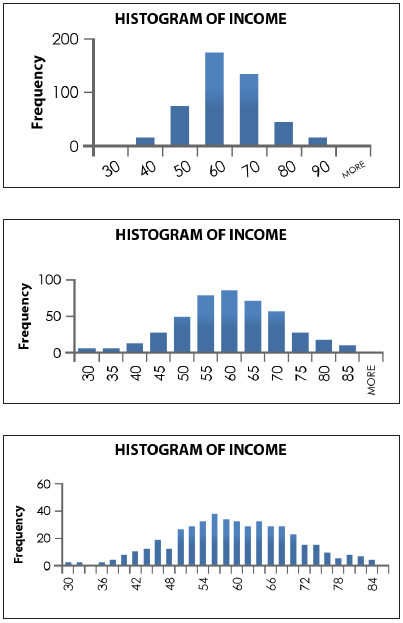
The following histogram displays the frequency distribution for this set of Waiting Times data: Note: The number of cells that reflect the data has an effect on the shape. There is another topic in this program that discusses those effects.


