Posts in category Methodology

Learn the in’s and out’s of DMAIC and DMADV, including individual methods, quality control standards and industry trends, with these articles from Six Sigma Daily – your source for Six Sigma news and information.


MethodologySix Sigma

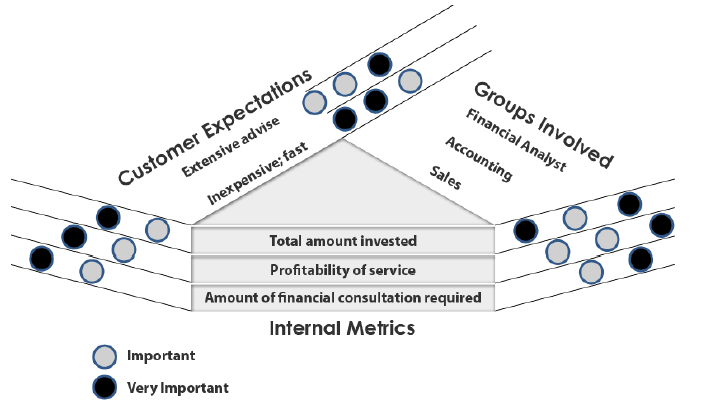
Matrix Diagram: L-Shaped

A Matrix Diagram is a tool that illustrates the critical relationships between or among two or more groups. It can be enhanced to show things like the strength of the relationship or the different aspects of the relationship. The basic L-Shaped Matrix Diagram shows the critical relationships of two groups of items (or it can be used to show the relationship of one group to itself).

Read more 0 Comments
MethodologySix Sigma

Standard Operating Procedures

A Standard Operating Procedure (SOP) is a set of written instructions that document a routine activity that is to be followed by members of an organization. Standard Operating Procedures are essential parts of good quality systems. Sound and well-written SOPs should enhance consistency and reduce human error. Note: sometimes standard operating procedures are referred to as Work Instructions.

Read more 0 Comments
MethodologySix Sigma

Run Chart: Shifts

A Run Chart is a basic graph that displays data values in a time sequence (the order in which the data were generated). A run chart can be useful for identifying shifts and trends. A supervisor of a customer service center collects data on the number of complaints that are filed each month. Data for the last several weeks are shown below.

Read more 0 Comments
MethodologySix Sigma

Run Chart: Trends

A Run Chart is a basic graph that displays data values in a time sequence (the order in which the data were generated). A Run Chart can be useful for identifying shifts and trends. Example: A supervisor of a customer service center collects data on the number of complaints that are filed each month. Data for the last several months are shown below.

Read more 0 Comments