
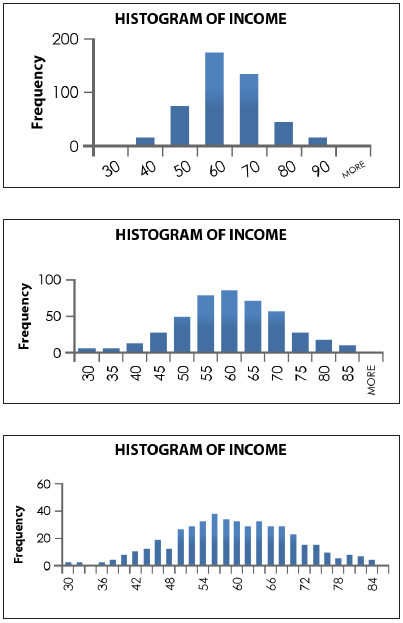
When constructing a histogram (a graph in which the classes are identified on the horizontal axis and the class frequencies are shown on the vertical axis by the heights of the vertical bars) it is important to choose an appropriate number of Cell Intervals (the grouping you will use to generate the classes for the histogram). As a rule of thumb, the number of cell intervals “K” can be chosen to equal the smallest whole number that makes 2K greater than the total number of measurements (n). However, this is not a hard and fast rule, so you may want to try a few different options (say, K – 1 intervals or K + 1 intervals) as well. Your interval length can then be computed to be (largest value – smallest value) divided by K.
Example: Suppose we have a group of data from a test administered to new employees to evaluate their understanding of a new financial product. The highest score possible on the test is 40. The results from 30 employees show a low score of 17 and a high score of 39.
To find the number of cell intervals to use, we would choose the value of K that makes 2K just greater than n = 30. Thus K would equal 5 (since 25 = 32). Thus we want 5 cell intervals and the width of our cell intervals is approximately:
![]()
Always “round up” to the next whole number. Notice in the example above that quotient came out to 4.4. Normally, we would round down to four, but if we did that we would only have four in each cell – which would be insufficient to cover the whole range of numbers 17 to 39. See below.
17 to 20 would be the first cell.
21 to 24 would be the second cell.
25 to 28 would be the third cell.
29 to 32 would be the fourth cell.
33 to 36 would be the final cell, which would make us short on the last cell because we needed values to cover through that number 39. So, always round up to the whole number.
Let’s use five cells (intervals) with five values in each cell. It would look like this:
17 to 21
22 to 26
27 to 31
32 to 36
37 to 41
You could have chosen to use 10 intervals instead of five and if you would have chosen 10 it would have looked like this:

17 – 19 ![]()
20 – 22
23 – 25
26 – 28
29 – 31
32 – 34
35 – 37
38 – 40
Notice that the last range goes to 40 which is one higher than 39, but that’s okay because eventually if we were to continue to collect data we might eventually see a 40.
So, we gave you two examples – one with five intervals, and the other example with six intervals in it. So, how do you know when to choose five, when to choose six, or when to choose seven, eight, or nine? There is no hard and fast rule on this, but here is a “rule of thumb” list.

Now we count the number of scores that fall into each cell and we are ready to generate the frequency distribution or histogram. See below.
