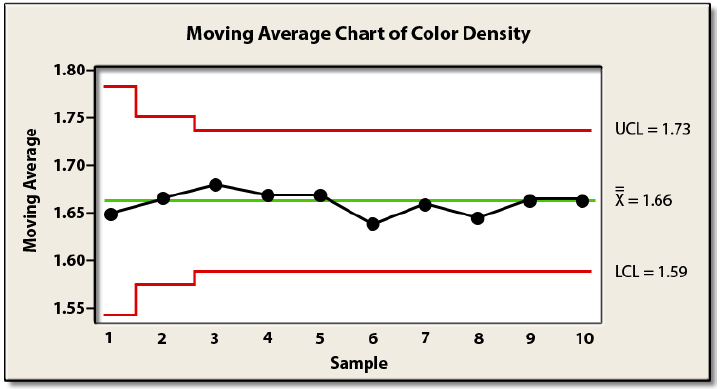
The Moving Average Control Chart is a time-weighted control chart that is constructed from a basic, unweighted moving average. It is often advisable to use the Moving Average Control Chart when you desire to detect a quickly detect a change or shift in the process since it is more sensitive to shifts in the process than the traditional average and range control chart (i.e., X-bar and R).
Example: A supplier of food packaging wishes to monitor the average color density of a particular design using the Moving Average Control Chart. Since the measurements are taken once from each roll of packaging, the subgroup size is one. In order to use the Moving Average Control Chart, you must choose the span (the number of values to average at a time) and the company has chosen a span of 3. The Moving Average Chart is given below.
Note that none of the plotted points exceed the control limits. Therefore, we would judge this process to be in control or stable. Keep the following observations in mind when using a Moving Average Control Chart.
- Usually, the magnitude of the shift that you wish to detect is inversely related to the span or number of values averaged at a given time. That is, smaller shifts are more likely to be detected with larger spans
- The basic approach to interpretation is simply to see if any points exceed the upper and lower control limits. If they do, the process is judged to be unstable (that is, not in statistical control)
- While the Moving Average Chart is, in general, more likely to detect shifts than the traditional. Average and Range Chart, it is not as sensitive as an Exponentially Weighted Moving Average chart (EWMA)

