
Vilfredo Pareto changed the way we see opportunity and solve problems. Pareto was an Italian economist who studied land ownership in Switzerland over 100 years ago. He discovered that 20% of the population owned 80% of the land.
This conclusion illustrated the difference between the significant few (the 20%) and the trivial many (the 80%), but by itself it was hardly groundbreaking. What made the world take notice of Pareto’s work was that this same pattern was true not only for land ownership in Switzerland over one hundred years ago, but also for many parts of our life, even today.
Modern technology, and sales follow the same pattern of the significant few and the trivial many that Pareto discovered in the late 1800’s.
- 80% of customers use 20% of an application’s capacity
- 80% of the problems originate from 20% of projects
- 80% of sales come from 20% of clients
How the Pareto Principle Applies to Six Sigma
Six Sigma project teams that follow the Pareto Principle know that most problems will result from a small number of causes. Teams can better understand the pain that the significant few problems can inflict on a process by visually displaying a Pareto Chart in graph form. Creating a chart for this information helps teams:
- See a process’ problems at a glance
- Understand quickly all of the factors working against the process
- Concentrate on the problems that cause the greatest disruption
Steps for Building a Pareto Chart
Teams can convert raw data into useful information by following a series of steps.
- Identify the problem under investigation.
- List the potential causes – Use existing data or brainstorm new ideas.
- Measure the problem with an easy-to-understand unit – The most common are frequency and cost.
- Choose the right period of time – Measure performance over a time period long enough to capture the situation. Select a period of time that is long enough to balance out seasonality and shorter weekly fluctuations.
- Collect data for each type of problem – This data can be current or historical.
- Measure the cost or frequency of each problem
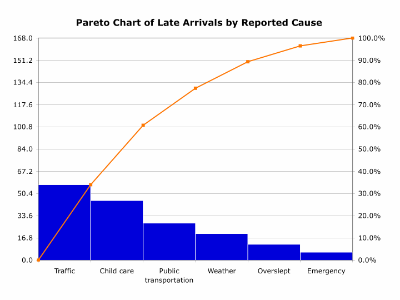
- Display problems and their costs on a graph – Plot problems on the horizontal line of the graph and frequencies or costs on the vertical line. Plot problems in descending order from left to right on the horizontal line. The problem with the highest frequency or cost is displayed at the far left of the horizontal line followed by the next most costly or frequent problem and so on.
Presenting a Pareto Chart in graphical form displays the types of problems that afflict the process and illustrates the relative significance of these problems. Using the Pareto Chart as a guide, project teams can decide which problems to address first. Six Sigma teaches project teams to address problems that impact customers and profitability first.
The Pareto Principle teaches that most of the problems in the process have just a few causes. The Six Sigma technique of creating a Pareto Chart takes this principle one step further and illustrates what these causes are and how much impact they have on the process.


