
A histogram allows you to see the frequency distribution of a data set. It offers an “at a glance” picture of a distribution pattern, charted in specific categories. Histograms are one of the most frequently used methods for charting historical data.
The data is typically displayed in a bar graph that gives viewers a way to quickly absorb the information. The key is to present the information in a logical order. It’s a simple chart that employs a horizontal and vertical axis.
When is a Histogram Used?
The main advantages of a histogram are its simplicity and versatility. It can be used in many different situations to offer an insightful look at frequency distribution. For example, it can be used in sales and marketing to develop the most effective pricing plans and marketing campaigns.
In Six Sigma, it is used to find variation in a process. A bar chart is used to show, for example, where delays are occurring by finding the frequency of delays in each step of the process. Using the data, project leaders can then find the best ways to reduce variation.
Benefits of a Histogram
Over time, histograms can show what the normal distribution is for a process that is running smoothly. However, by routinely producing histograms, any variation is quickly detected. This is a major advantage for organizations because it supports finding and dealing with process variation quickly.
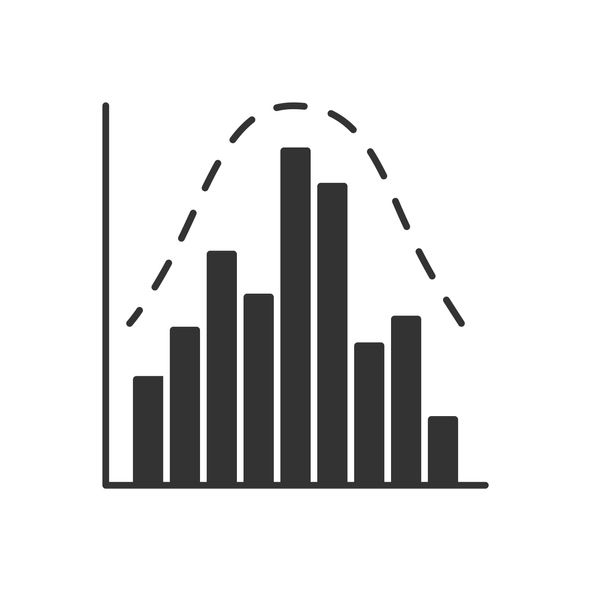
A bell-shaped curve to the bar graph usually indicates normal distribution. Spikes in the graph indicate variation that should be addressed. Such spikes can also indicate opportunities to capitalize on a trend, as can be seen in the restaurant example below.
Examples of Using a Histogram
Restaurant managers might build a histogram to determine how many customers come into a restaurant at different times during the day. The number of patrons is on the vertical axis, while the time intervals are on the horizontal axis. The chart would find the frequency distribution for when restaurant patrons arrive (25 come in at 9 a.m.; 77 at noon, etc.). If huge spikes are seen at certain times of the day, managers can find ways to capitalize on this increased traffic (specialty items, pricing adjustments).
Similarly, a histogram could show how many items a retail store sells in one day. Let’s say the items are pencils. The number of pencils sold would be on the vertical, with the time intervals on the horizontal. Again, adjustments in pricing and marketing efforts could be adjusted based on when the item is most popular.
In evaluating a process, spikes in a histogram indicate an issue. If a histogram is made for the waiting time at an outpatient clinic, high spikes would indicate that waiting times are too long during certain parts of the day (wait time intervals would be on the vertical axis, while time intervals are on the horizontal axis). A deeper look into the process is then needed to determine what are the best solutions to smooth out the variation.
Histograms provide a simple but effective solution to many process issues. They offer a way to visualize frequency distribution, providing a great first step by charting historical data that gives a snapchat of how a process is working.

