
Six Sigma Tools: What is a Histogram?
A histogram allows you to see the frequency distribution of a data set. It offers an “at a glance” picture of a distribution pattern, charted in specific categories. Histograms are …

A histogram allows you to see the frequency distribution of a data set. It offers an “at a glance” picture of a distribution pattern, charted in specific categories. Histograms are …

Six Sigma is a powerfully effective methodology for quality improvement – no matter the industry or vertical. Here are four of the most important of the Six Sigma statistical tools: …
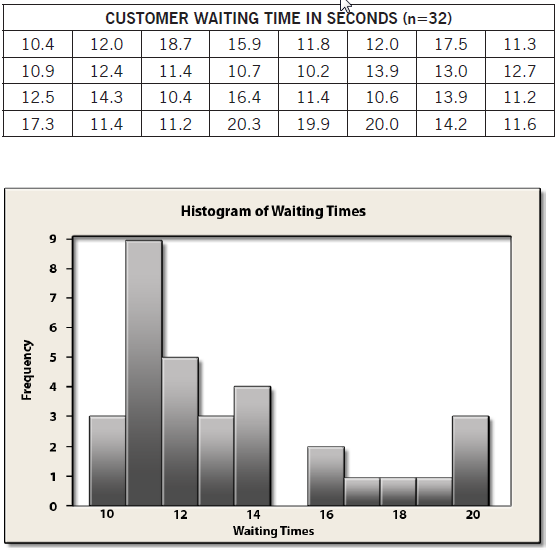
Histograms are used to show the distribution of a set of collected data.
Generic bar charts can be created for any type of categorical or numerical data. If the categories of the data plotted in a bar chart have no meaningful order, many different charts can be created by rearranging the order of the bars. Histograms, on the other hand, are used to show the pattern or the distribution of the data across the categories, so there must be only one correct pattern.
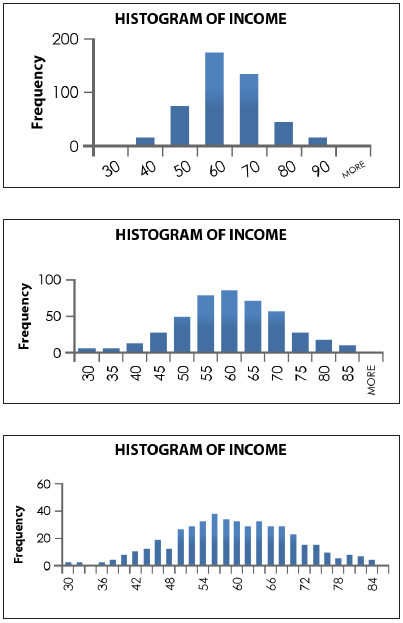
The choice of Cell Intervals (the number and width of the classes used to construct a histogram) can have an effect on the shape of the histogram. In general, a smaller number of intervals results in a less distinct shape, while a larger number of intervals can reveal unexpected patterns.
Note: Please refer to the other topic on cell intervals for more information about rules-of-thumb in regard to cell choices.