
Standard Deviation: Description and Example
The Standard Deviation of a set of data describes the amount of variation in the data set by measuring, and essentially averaging, how much each value in the data set …

The Standard Deviation of a set of data describes the amount of variation in the data set by measuring, and essentially averaging, how much each value in the data set …

The service world has recognized the value of poka-yoke during the last several years. One way of applying error-proofing (poka-yoke) in the service sector is to devise a “task” poka-yoke. A task poka-yoke concentrates on the tasks that a server must perform and devises methods to assure the task is completed correctly. A popular example of a task poka-yoke is the automatic change dispenser that you encounter in many stores.

A small assembler provides wiring harness assemblies for a particular automotive electronic controller. There are several part numbers and many of the parts for each part number look very much alike. So it isn’t surprising that the company has received complaints from the automotive assembly plants that some harnesses have incorrect components (which have to be changed out on the assembly line causing delays).

Poka-yoke (poh ka yoke) is a mistake-proofing approach to eliminating errors that was developed by the Japanese engineer Shiego Shingo in the 1960s. The word “poka-yoke” is derived from a Japanese word that means “to avoid errors.” Poka-yoke makes use of simple but effective tools and signals to prevent errors from occurring.

A Prioritization Matrix is typically an L-shaped matrix which makes pairwise comparisons of established criteria and options. The prioritization matrix is a rigorous method and requires skill to use effectively. It is also applicable to many situations and has several different configurations. To be used effectively, the criteria and the options must be clearly developed and a scheme for weighing them must be applied.

An Affinity Diagram is an analytical tool used to organize many ideas into subgroups with common themes or common relationships. The method is reported to have been developed by Jiro Kawakita and so is sometimes referred to as the K-J method.

An Activity Network Diagram is a diagram of project activities that shows the sequential relationships of activities using arrows and nodes. An activity network diagram tool is used extensively in and is necessary for the identification of a project’s critical path (which is used to determine the expected completion time of the project).
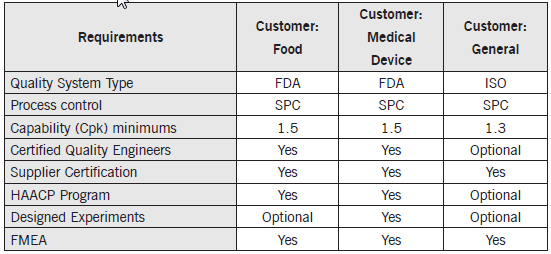
A Matrix Diagram is a tool that illustrates the critical relationships between or among two or more groups. It can be enhanced to show things like the strength of the relationship or the different aspects of the relationship. The basic L-Shaped Matrix Diagram shows the critical relationships of two groups of items (or it can be used to show the relationship of one group to itself).
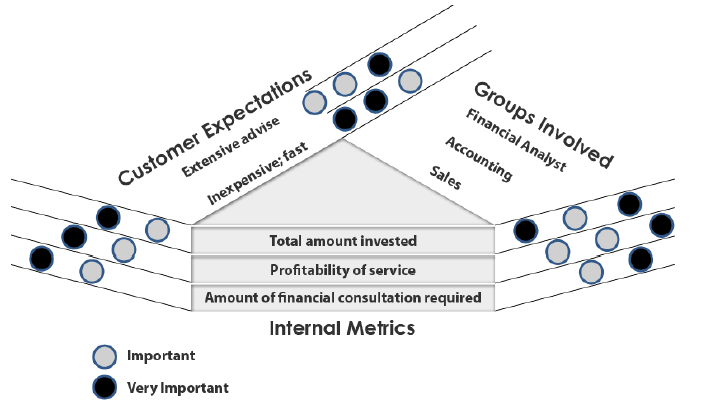
A Matrix Diagram is a tool that illustrates the critical relationships between or among two or more groups. It can be enhanced to show things like the strength of the relationship or the different aspects of the relationship. The basic Y-Shaped Matrix Diagram typically shows the critical relationships of three groups of items in a kind of circular flow.
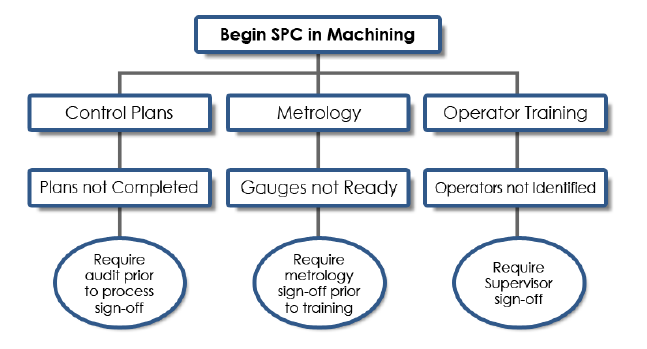
A Process Decision Program Chart (PDPC) is a tool for identifying and documenting the steps required to complete a process. It is also useful for anticipating any issues and problems that might surface in the implementation of the process, therefore affording the opportunity to devise countermeasures.