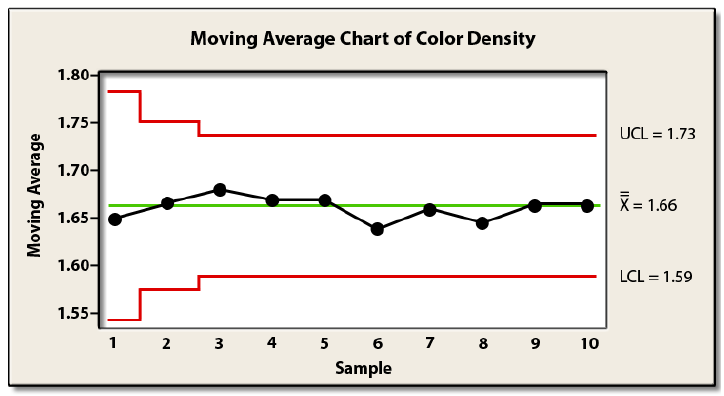
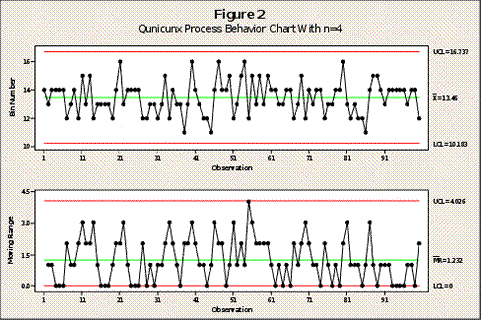
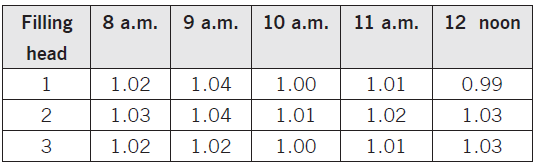
admin

About the Author admin


MethodologySix Sigma

Moving Average Chart: Construction

The Moving Average Control Chart is a time-weighted control chart that is constructed from a basic, unweighted moving average. It is often advisable to use the moving average control chart when you desire to quickly detect a change or shift in the process since it is more sensitive to shifts in the process than the traditional average and range control chart (i.e., X-bar and R). Under the appropriate conditions, however, it is not as sensitive as the Exponentially Weighted Moving Average chart (EWMA).

Read more 0 Comments
MethodologySix Sigma

Matrix Diagram: X-Shaped

A Matrix Diagram is a tool that illustrates the critical relationships between or among two or more groups. It can be enhanced to show things like the strength of the relationship or the different aspects of the relationship. The basic X-Shaped Matrix Diagram typically shows the critical relationships of four groups of items in a kind of circular flow.

Read more 0 Comments
MethodologySix Sigma

X-MR Control Chart Construction Rules

Studying Six Sigma? Learn the X-MR control chart construction rules here. 1. The data must be continuous.

2. The sample size is 1 and cannot vary.

3. Collect the data in a consecutive manner. (In production order)

4. For the first chart on a process, collect at least 20–25 sample groups to ensure that an adequate measure of process variation has been taken.

5. Calculate the data points to be plotted on the chart.

Read more 0 Comments