
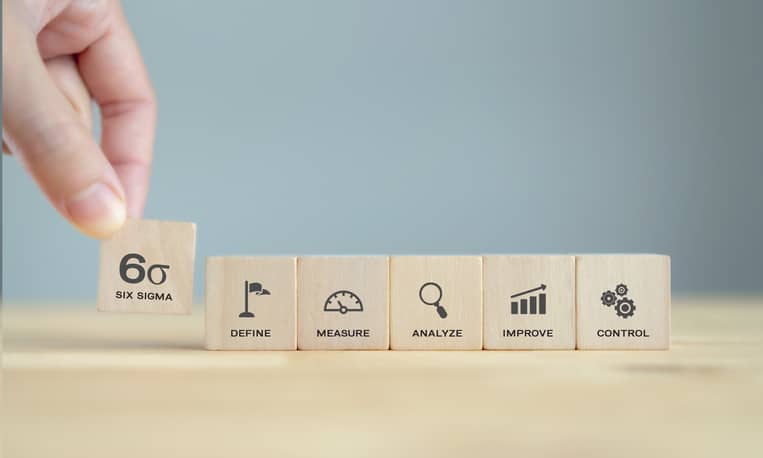
 Cause-and-effect diagrams are one of the tools that Six Sigma professionals use to obtain the perspectives of individual members of a project team. The cause-and-effect diagram is a graphical brainstorming tool used to help capture the possible causes of a problem. This tool can be used in the analyze stage to determine underlying causes of a problem or in the improve stage to identify potential failure modes.
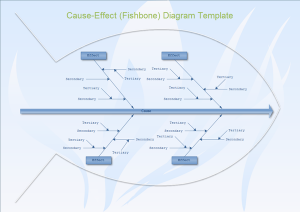
The cause-and-effect diagram is also known as the fishbone diagram because on paper it takes the shape of a fish skeleton. The problem to be analyzed is listed at the head of the skeleton; a horizontal line that acts as the fish’s spine begins at the head and stretches horizontally outward, diagonal lines that represent factors that may be part of the problem branch out from the spine and are augmented with additional lines that list the problem’s possible causes.
Defining the problem
Creating a cause and effect diagram begins by defining and stating the problem that will be analyzed. This is a crucial step in the process because if the problem is misunderstood, misstated or only a symptom rather than a root cause, then the subsequent work of creating the diagram will result in time wasted by answering the wrong question. Before creating a fishbone diagram ensure that the problem is correctly understood and defined.
Identifying a problem is a subjective process where the quantitative tools of Six Sigma don’t come into play. The best way to ensure that the project team is focusing on the right problem, not just a symptom, is to examine the problem broadly and thoroughly, from many different perspectives. CATWOE analysis provides a rigorous process for seeing the problem from multiple viewpoints. CATWOE is an acronym that represents different perspectives a problem, these include the perspectives of:
- Clients – Who are the beneficiaries or victims of this particular system? Who would benefit or suffer from its operations?
- Actors – Who is responsible for implementing this system? Who carries out the activities that make the process work?
- Transformation – What transformation does this system bring about? What are the inputs and what transformation do they go through to become outputs?
- Worldview – What particular worldview justifies the existence of this system?
- Owner – Who has the authority to abolish this system or change its measures of performance?
- Environmental constraints – Which external constraints does this system take as a given?
Seeing the issue from different perspectives helps the project team understand the problem and makes it more likely that the subsequent cause-and-effect analysis is addressing the right problem.
Filling in the fishbone
Once the correct problem is placed at the head of the diagram the major branches from the spine can be completed by brainstorming or by adding the main categories of factors that may be part of the problem these are often called the 5Ms and E (this method is similar to the 6M’s). These are areas where problems can arise they include manpower, machines, methods, material, measurement and environment. The spine of the diagram can also be augmented by the 4Ps of policy, procedures, plant and people.
Once the main problem factors are in place on the diagram the team may begin to brainstorm the possible causes of problem that are related to these factors. These possible causes are drawn as shorter lines branching off the main factors.
Once complete the cause-and-effect diagram provides a graphical analysis of the problem and its potential causes. More importantly the process of creating the diagram has focused the project team on the true problem and on identifying the problem’s root causes to pave the way for data collection and analysis.

