
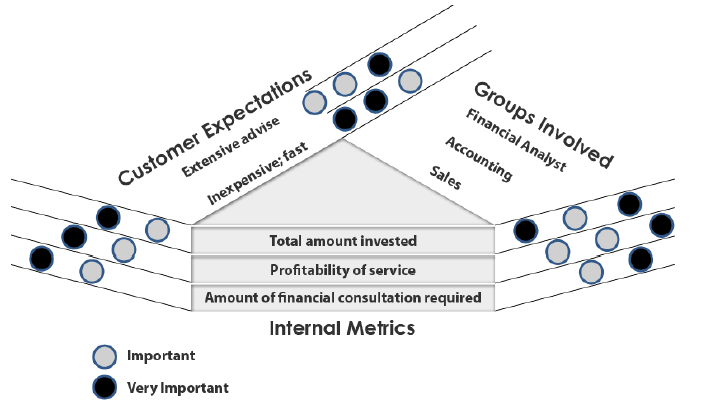
A Matrix Diagram is a tool that illustrates the critical relationships between or among two or more groups. It can be enhanced to show things like the strength of the relationship or the different aspects of the relationship. The basic X-Shaped Matrix Diagram typically shows the critical relationships of four groups of items in a kind of circular flow.
Example: The X-shaped matrix diagram below is used to illustrate the relationship between the Plant, the Supplier, the Product, and the Type of Customer as a function of whether the technical requirements of production are “high” or “normal”.

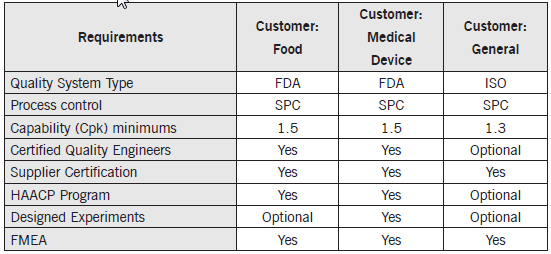
Again, one of the great benefits of a matrix diagram is its ability to summarize lots of information into a very compact form.
![]()
